Este artículo también está disponible en español.
A crypto analyst has shared an XRP price chart, analyzing its action on the 4-hour timeframe while pinpointing key metrics of strength that suggest a possible rally. The analyst has predicted that XRP is preparing for a significant run to $11, marking a new All-Time High (ATH).
Key Metrics Suggest XRP Price Set For $11 Surge
In an X (formerly Twitter) post on Tuesday, prominent crypto analyst Javon Marks shared key observations of XRP’s price behavior, noting signs of strength through crucial metrics and a potential for a significant price rally to a new ATH at $11. The analyst has suggested that XRP shows clear upward momentum, with a sharp increase visible on the presented price chart.
Related Reading
Looking at the chart, XRP has been breaking recent resistance levels and maintaining bullish momentum. XRP’s strongest resistance at $0.5, which lasted for over three years, was broken earlier in November, jumping above $1 following Donald Trump’s victory in the US Presidential elections. Currently, the XRP price is trading above $2.5, underscoring the massive growth surge it has experienced in less than two months.
Marks has revealed that he was keeping a close watch on alternative larger-term metrics for the XRP price that signal a potential surge to new ATHs. The volume bars below the price chart indicate steady buying pressure for XRP, with increasing trading volume during upward trends.
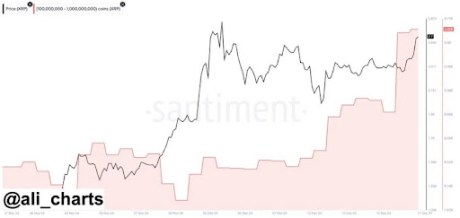
Recently, the XRP accumulation trend among large holders has increased significantly. Crypto analyst Ali Martinez revealed via a price chart that whales have purchased a staggering 30 million XRP within the last 24 hours. This increased buying activity reflects the growing confidence in XRP, possibly fueled by the market’s bullish sentiment and expectations of a price rally.

At the bottom of the XRP chart shared by Marks, the Relative Strength Index (RSI) illustrates a sharp upward curve, signaling the potential for a bull rally. The RSI appears as a fluctuating black line, clearly reflecting rising momentum. If XRP can sustain its current uptrend, it could surpass its current all-time high of $3.84 set during the 2021 bull market, potentially reaching a new high above $11 in this bull cycle.
Update On XRP Analysis
The XRP price has been persistently attempting to break through the resistance area at $2.5, aiming to reach new highs. Over the past month, XRP has had an impressive performance, recording a whopping 119.5% price increase. Despite being in consolidation, the cryptocurrency continues to exhibit strong growth, with its price climbing nearly 8% in the last seven days as it attempted to break through key resistance levels.
Related Reading
Data from CoinMarketCap has revealed that the XRP price is currently trading at $0.252. The cryptocurrency remains the third largest based on market capitalization after Bitcoin and Ethereum. Additionally, XRP has seen a notable increase in its daily trading volume, surging by 53.72% at the time of writing.
Featured image created with Dall.E, chart from Tradingview.com
#XRP #Price #Ready #Run #ATH #Alternative #Larger #Metrics #Show #Answer
Source link


