IvyCraft Review: AI Workspace For Infographics, Video and Podcasts
Most people working with AI today are not using one tool. They are using multiple tools for a single task. A PDF goes into ChatGPT for a summary, key points are copied into Canva for design, and a script moves into ElevenLabs for audio. Similarly, a slide deck gets built in Gamma. Then everything is checked again against the original source because nobody fully trusts the output. That is the modern version of tab overload.
ChatGPT and Claude are strong with text, but visuals still take work. NotebookLM is excellent for source-based summaries and audio overviews, but it does not give users much creative design control. Gamma makes quick slides, but it does not turn research into podcasts, comics, videos, or broader creative assets.
IvyCraft enters that gap. It is not just another chat box, but works more like an integrated AI creation workspace built for people who need to turn source material into finished communication assets.
What Is IvyCraft?
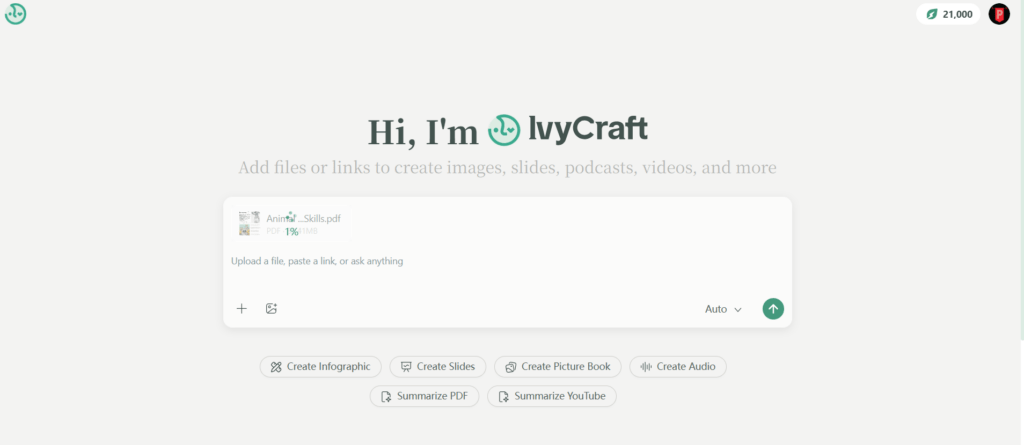
IvyCraft is a source-to-screen AI creation workspace. That means it starts with raw material and helps turn it into polished outputs. The input side is broad. Users can upload PDFs, paste URLs, add video links, work with audio files, or start from text. The output side is where IvyCraft becomes more interesting. It can generate infographics, slides, videos, comics, podcasts, posters, and storybook-style content from the same source base.
The most useful part is source tracing. When IvyCraft generates a claim, users can trace it back to the original material. AI tools are useful, but only when the user can verify where the information came from. IvyCraft is designed around that need, which makes it more practical for research, education, marketing, and business content. In other words, IvyCraft is positioned as a platform that moves beyond simple chat by turning documents, videos, and audio into multiple content formats.
How IvyCraft Was Tested?
For this review, IvyCraft was tested across two weeks of regular use. The input materials included a 20-page academic PDF on climate technology, a 45-minute YouTube investor lecture, and a recorded internal team audio memo. These were chosen on purpose. A good AI workspace should not only handle clean text. It should be able to make sense of dense research, spoken content, and messy internal material.
The outputs tested included one slide deck, one infographic, one short video, one comic strip, and one podcast script. The IvyCraft review focused on three things: whether the outputs stayed coherent, whether the design quality was usable without heavy fixing, and whether the platform reduced hallucination by tying claims back to source content.
Results:
Deep Dive: Core Features
Here are some core features of IvyCraft that you should know about:
The Source Library
The Source Library is where IvyCraft starts to feel less like a chatbot and more like a workspace.
Instead of asking questions in an empty chat window, users first upload or add their source materials. That could be a PDF report, a YouTube lecture, an audio memo, a URL, or a text document. IvyCraft then reads those materials before generating anything.
That matters more than it sounds. In many AI tools, users spend half the time reminding the model what the project is about. IvyCraft keeps the source context available. The workflow feels closer to building from a research folder than chatting with a general model.
For researchers, this is useful because arguments stay closer to the source. For marketers, it means one webinar or white paper can become several content assets. For teachers, a lesson can start from one video or chapter and turn into a visual learning material.
AI Infographics: The Visual Breakthrough
The infographic tool is one of IvyCraft’s strongest features. The basic process is simple. Highlight or select content, then generate an infographic. The question is whether IvyCraft simply dumps bullet points into a decorative template or actually understands the information.
The answer is mixed, but mostly positive. For the climate tech PDF, IvyCraft did more than create a circle of bullets. It grouped related ideas, separated causes from outcomes, and turned timeline-style information into a visual flow. The first version still needed refinement, mostly spacing and wording, but the logic of the layout made sense.
This is where IvyCraft stands apart from text-first AI tools. A summary is useful, but an infographic changes how quickly someone else can understand the material. The platform seems to understand that knowledge work does not end with comprehension. It ends when the idea can be communicated clearly.
Results:
The weaker side needs polishing. Dense source material can lead to crowded visuals. Shorter, cleaner sections produce better infographics. Still, as a first draft, the feature is strong enough to save serious time.
AI Video and Comics
The video and comic tools are built for repurposing. That is where IvyCraft starts becoming valuable for educators, marketers, and internal communication teams.
A dry report can become a short explainer video. A lecture can become a comic strip for students. A webinar can turn into short social content.
The short video output was best when the topic had a clear structure. The investor lecture, for example, converted well into a short “key takeaways” video. The pacing was acceptable, the script was readable, and the visuals followed the main ideas. It was not a replacement for a professional editor. It was, however, a very solid first version.
Result:
The voiceover quality was usable. It sounded clean enough for internal content, learning material, and social snippets. For polished brand campaigns, manual editing would still help.
The comic output was surprisingly effective for education-style content. IvyCraft turned abstract climate tech concepts into a sequence of panels that felt easier to follow than a plain summary.
The main limitation is depth. IvyCraft’s AI video feature is better for short loops, explainers, and social clips than long narrative videos. That is not a failure. It is just where the tool currently fits best.
AI Slides: The Gamma Competitor
Slides are where IvyCraft enters more familiar territory. Gamma, Tome, and similar tools already made prompt-to-deck generation popular.
IvyCraft’s advantage is not that it creates slides. It is that the slides are grounded in the uploaded source material.
When the climate tech PDF was converted into a deck, IvyCraft did a decent job identifying the argument structure. It opened with the problem, moved into market forces, then covered technology categories and investment implications. That is better than simply shuffling facts.
If the goal is a quick startup pitch from a short prompt, Gamma may feel faster. If the goal is a slide deck based on a real document, IvyCraft feels safer.
Source Traceability: The Fact-Check Mode
Source traceability is one of IvyCraft’s most important features.
When a generated output contains a claim, users can trace that claim back to the source. In practice, this reduces the anxiety that comes with AI-generated material. Instead of rereading the entire PDF to verify one point, users can jump back to the original section.
NotebookLM is already strong in source-grounded Q&A. IvyCraft’s key move is applying similar trust mechanics to creative outputs. A slide, infographic, or podcast script is more useful when it can still point back to the original source.
For casual users, this may feel like a nice bonus. For professional users, it is one of the reasons the product is worth taking seriously.
Workflow Comparison: Before Vs. After
The biggest value of IvyCraft becomes obvious when comparing workflows.
Scenario
The Old Way
The IvyCraft Way
Researcher
Read PDF for 2 hours, summarize in Word, build PowerPoint manually
Upload PDF, generate summary, convert key sections into infographic and slides
Teacher
Find YouTube video, write questions, search for images, create worksheet
Paste video URL, generate comic strip, create quiz or lesson asset
Marketing Team
Listen to webinar, transcribe audio, feed notes into ChatGPT, design assets in Canva
Upload audio, extract quotes, generate video clips and visual content
Analyst
Review long report, pull charts manually, build executive summary
Upload source, generate slide deck, trace claims back to source
Internal Team
Turn meeting audio into notes, then rewrite for updates
Upload audio memo, generate summary, podcast script, and short shareable content
This is where IvyCraft’s value becomes clearer. It does not only save time on one task. It reduces handoffs between tools.
That matters because most knowledge work is not difficult at one step. It becomes difficult because the work keeps moving between apps.
Why Choose IvyCraft Over NotebookLM?
NotebookLM is a strong tool. It is especially useful for source-based Q&A and audio summaries. But it has limits.
NotebookLM can help users understand sources, but its creative flexibility is narrower. Its generated images cannot be edited afterward in the same way a design workspace allows. Outside of image and podcast generation, users still rely heavily on prompts and external tools to create visual assets.
IvyCraft does not have that same limitation. It supports a wider range of outputs, including PPTX presentations, infographics, comics, podcasts, posters, videos, and more. That makes it more useful when the goal is not only to understand material but to turn that material into communication.
Source traceability is also comparable in intent. Both platforms take grounding seriously. The difference is that IvyCraft carries that traceability into more content formats.
So the choice is not simply “IvyCraft vs. NotebookLM.” It is more about the job. If the goal is studying and asking questions, NotebookLM works well. If the goal is turning source material into finished creative assets, IvyCraft has the broader workspace.
Head-To-Head Comparison
Feature
IvyCraft
NotebookLM
Gamma
ChatGPT
Core Output
Visual + Audio + Text
Audio + Notes
Slides
Text/Chat
Infographics
Native
No
Limited
Limited
Video/Comics
Yes
No
No
No
Podcasts
Yes
Yes
No
Script only
Slides
Yes
No native deck generation
Yes
Outline only
Source Citation
Strong visual/source tracing
Strong text grounding
Limited
Depends on input
Best For
End-to-end content creation
Study and source Q&A
Quick decks
Brainstorming and writing
IvyCraft’s strongest advantage is range. It combines analysis and creation in a way most competitors do not.
Pros And Cons
Here are some pros and cons that can help you come up with a decision:
Pros
The Glue is Real:IvyCraft brings reading, summarizing, designing, and repurposing into one flow. That is its strongest quality.
Visual IQ is Better than Expected: The infographic and comic tools are not just decorative. They often organize ideas in a way that makes sense.
Source Tracing Builds Trust: Being able to click back to original material reduces the “black box” feeling that comes with many AI tools.
Good for Repurposing: One source can become a deck, podcast, short video, and visual summary.
Cons
Video Still Works Best for Short Content: It is useful for clips and explainers, but not yet a full replacement for long-form video production.
The Workspace Model Takes Adjustment: Users coming from ChatGPT may expect to start typing immediately. IvyCraft works better when sources are uploaded first.
Visual Exports May Need Cleanup: Dense infographics and slides can require manual spacing fixes before final use.
Pricing And Value
IvyCraft’s value depends on how many tools it replaces. A typical content or research workflow may involve Canva Pro, ChatGPT Plus, NotebookLM, a video tool, a podcast tool, and a slide generator. Even if some of those tools are free, the workflow still costs time and attention.
Basic: $7.00/month with 10,000 tokens
Pro: $14.00/month with 20,000 tokens
Max: $70.00/month with 100,000 tokens
Who Is IvyCraft For?
Good Fit
Researchers and Analysts who need to turn dense source material into visual briefs, slides, or summaries.
Educators who want to make lessons more engaging by converting chapters or videos into comics, quizzes, storyboards, or audio material.
Content Marketers who need to repurpose one webinar, report, or podcast into multiple pieces of content.
Consultants who regularly turn research into decks, client summaries, and visual explanations.
Bad Fit
Coders who need advanced code execution, debugging, or notebook-style computation.
Users Who Only Need Simple Chat may find the workspace model more than they need.
FAQ
Is IvyCraft Better Than NotebookLM?
It depends on the use case. NotebookLM is excellent for source Q&A and audio overviews. IvyCraft is stronger when users need multiple output formats, such as slides, infographics, comics, podcasts, posters, and videos. It is better for creation, not just study.
Can IvyCraft Generate AI Podcasts From My PDF?
Yes. IvyCraft can use uploaded source material, such as PDFs, to generate podcast-style scripts or audio content. This is useful for turning long reports or research documents into easier listening formats.
Is The Infographic Export High Resolution?
IvyCraft’s infographic output is usable for presentations, internal reports, teaching material, and social content. Complex visuals may still need light editing, especially when the source material is dense.
Does IvyCraft Hallucinate Facts?
IvyCraft reduces hallucination risk by grounding outputs in uploaded sources and offering traceability. That does not mean users should skip review. It means fact-checking is much easier because claims can be traced back to the original material.
Can I Edit the Slides After AI Generates Them?
Yes. IvyCraft-generated slides can be adjusted after creation. In practice, most decks still benefit from light editing before presentation, especially around wording, spacing, and visual emphasis.
The Verdict
IvyCraft earns a strong 4.5 out of 5. It is not just a chat wrapper. The platform understands something many AI tools still miss: knowledge work does not stop at summarization. Most professionals need to explain, present, teach, publish, or repurpose what they learn. That is where IvyCraft stands out. It connects source understanding with content creation, and it does so across formats that usually require several tools. It still has rough edges. Some features might need improvement, but the direction is right. For anyone tired of copying text between AI tools, design apps, slide generators, and audio tools, IvyCraft feels like a serious step forward. Stop switching tabs. Start crafting. Try IvyCraft for free!
Most people working with AI today are not using one tool. They are using multiple tools for a single task. A PDF goes into ChatGPT for a summary, key points are copied into Canva for design, and a script moves into ElevenLabs for audio. Similarly, a slide deck gets built in Gamma. Then everything is checked again against the original source because nobody fully trusts the output. That is the modern version of tab overload.
ChatGPT and Claude are strong with text, but visuals still take work. NotebookLM is excellent for source-based summaries and audio overviews, but it does not give users much creative design control. Gamma makes quick slides, but it does not turn research into podcasts, comics, videos, or broader creative assets.
IvyCraft enters that gap. It is not just another chat box, but works more like an integrated AI creation workspace built for people who need to turn source material into finished communication assets.
What Is IvyCraft?
IvyCraft is a source-to-screen AI creation workspace. That means it starts with raw material and helps turn it into polished outputs. The input side is broad. Users can upload PDFs, paste URLs, add video links, work with audio files, or start from text. The output side is where IvyCraft becomes more interesting. It can generate infographics, slides, videos, comics, podcasts, posters, and storybook-style content from the same source base.
The most useful part is source tracing. When IvyCraft generates a claim, users can trace it back to the original material. AI tools are useful, but only when the user can verify where the information came from. IvyCraft is designed around that need, which makes it more practical for research, education, marketing, and business content. In other words, IvyCraft is positioned as a platform that moves beyond simple chat by turning documents, videos, and audio into multiple content formats.
How IvyCraft Was Tested?
For this review, IvyCraft was tested across two weeks of regular use. The input materials included a 20-page academic PDF on climate technology, a 45-minute YouTube investor lecture, and a recorded internal team audio memo. These were chosen on purpose. A good AI workspace should not only handle clean text. It should be able to make sense of dense research, spoken content, and messy internal material.
The outputs tested included one slide deck, one infographic, one short video, one comic strip, and one podcast script. The IvyCraft review focused on three things: whether the outputs stayed coherent, whether the design quality was usable without heavy fixing, and whether the platform reduced hallucination by tying claims back to source content.
Results:
Deep Dive: Core Features
Here are some core features of IvyCraft that you should know about:
The Source Library
The Source Library is where IvyCraft starts to feel less like a chatbot and more like a workspace.
Instead of asking questions in an empty chat window, users first upload or add their source materials. That could be a PDF report, a YouTube lecture, an audio memo, a URL, or a text document. IvyCraft then reads those materials before generating anything.
That matters more than it sounds. In many AI tools, users spend half the time reminding the model what the project is about. IvyCraft keeps the source context available. The workflow feels closer to building from a research folder than chatting with a general model.
For researchers, this is useful because arguments stay closer to the source. For marketers, it means one webinar or white paper can become several content assets. For teachers, a lesson can start from one video or chapter and turn into a visual learning material.
AI Infographics: The Visual Breakthrough
The infographic tool is one of IvyCraft’s strongest features. The basic process is simple. Highlight or select content, then generate an infographic. The question is whether IvyCraft simply dumps bullet points into a decorative template or actually understands the information.
The answer is mixed, but mostly positive. For the climate tech PDF, IvyCraft did more than create a circle of bullets. It grouped related ideas, separated causes from outcomes, and turned timeline-style information into a visual flow. The first version still needed refinement, mostly spacing and wording, but the logic of the layout made sense.
This is where IvyCraft stands apart from text-first AI tools. A summary is useful, but an infographic changes how quickly someone else can understand the material. The platform seems to understand that knowledge work does not end with comprehension. It ends when the idea can be communicated clearly.
Results:
The weaker side needs polishing. Dense source material can lead to crowded visuals. Shorter, cleaner sections produce better infographics. Still, as a first draft, the feature is strong enough to save serious time.
AI Video and Comics
The video and comic tools are built for repurposing. That is where IvyCraft starts becoming valuable for educators, marketers, and internal communication teams.
A dry report can become a short explainer video. A lecture can become a comic strip for students. A webinar can turn into short social content.
The short video output was best when the topic had a clear structure. The investor lecture, for example, converted well into a short “key takeaways” video. The pacing was acceptable, the script was readable, and the visuals followed the main ideas. It was not a replacement for a professional editor. It was, however, a very solid first version.
Result:
The voiceover quality was usable. It sounded clean enough for internal content, learning material, and social snippets. For polished brand campaigns, manual editing would still help.
The comic output was surprisingly effective for education-style content. IvyCraft turned abstract climate tech concepts into a sequence of panels that felt easier to follow than a plain summary.
The main limitation is depth. IvyCraft’s AI video feature is better for short loops, explainers, and social clips than long narrative videos. That is not a failure. It is just where the tool currently fits best.
AI Slides: The Gamma Competitor
Slides are where IvyCraft enters more familiar territory. Gamma, Tome, and similar tools already made prompt-to-deck generation popular.
IvyCraft’s advantage is not that it creates slides. It is that the slides are grounded in the uploaded source material.
When the climate tech PDF was converted into a deck, IvyCraft did a decent job identifying the argument structure. It opened with the problem, moved into market forces, then covered technology categories and investment implications. That is better than simply shuffling facts.
If the goal is a quick startup pitch from a short prompt, Gamma may feel faster. If the goal is a slide deck based on a real document, IvyCraft feels safer.
Source Traceability: The Fact-Check Mode
Source traceability is one of IvyCraft’s most important features.
When a generated output contains a claim, users can trace that claim back to the source. In practice, this reduces the anxiety that comes with AI-generated material. Instead of rereading the entire PDF to verify one point, users can jump back to the original section.
NotebookLM is already strong in source-grounded Q&A. IvyCraft’s key move is applying similar trust mechanics to creative outputs. A slide, infographic, or podcast script is more useful when it can still point back to the original source.
For casual users, this may feel like a nice bonus. For professional users, it is one of the reasons the product is worth taking seriously.
Workflow Comparison: Before Vs. After
The biggest value of IvyCraft becomes obvious when comparing workflows.
Scenario
The Old Way
The IvyCraft Way
Researcher
Read PDF for 2 hours, summarize in Word, build PowerPoint manually
Upload PDF, generate summary, convert key sections into infographic and slides
Teacher
Find YouTube video, write questions, search for images, create worksheet
Paste video URL, generate comic strip, create quiz or lesson asset
Marketing Team
Listen to webinar, transcribe audio, feed notes into ChatGPT, design assets in Canva
Upload audio, extract quotes, generate video clips and visual content
Analyst
Review long report, pull charts manually, build executive summary
Upload source, generate slide deck, trace claims back to source
Internal Team
Turn meeting audio into notes, then rewrite for updates
Upload audio memo, generate summary, podcast script, and short shareable content
This is where IvyCraft’s value becomes clearer. It does not only save time on one task. It reduces handoffs between tools.
That matters because most knowledge work is not difficult at one step. It becomes difficult because the work keeps moving between apps.
Why Choose IvyCraft Over NotebookLM?
NotebookLM is a strong tool. It is especially useful for source-based Q&A and audio summaries. But it has limits.
NotebookLM can help users understand sources, but its creative flexibility is narrower. Its generated images cannot be edited afterward in the same way a design workspace allows. Outside of image and podcast generation, users still rely heavily on prompts and external tools to create visual assets.
IvyCraft does not have that same limitation. It supports a wider range of outputs, including PPTX presentations, infographics, comics, podcasts, posters, videos, and more. That makes it more useful when the goal is not only to understand material but to turn that material into communication.
Source traceability is also comparable in intent. Both platforms take grounding seriously. The difference is that IvyCraft carries that traceability into more content formats.
So the choice is not simply “IvyCraft vs. NotebookLM.” It is more about the job. If the goal is studying and asking questions, NotebookLM works well. If the goal is turning source material into finished creative assets, IvyCraft has the broader workspace.
Head-To-Head Comparison
Feature
IvyCraft
NotebookLM
Gamma
ChatGPT
Core Output
Visual + Audio + Text
Audio + Notes
Slides
Text/Chat
Infographics
Native
No
Limited
Limited
Video/Comics
Yes
No
No
No
Podcasts
Yes
Yes
No
Script only
Slides
Yes
No native deck generation
Yes
Outline only
Source Citation
Strong visual/source tracing
Strong text grounding
Limited
Depends on input
Best For
End-to-end content creation
Study and source Q&A
Quick decks
Brainstorming and writing
IvyCraft’s strongest advantage is range. It combines analysis and creation in a way most competitors do not.
Pros And Cons
Here are some pros and cons that can help you come up with a decision:
Pros
The Glue is Real:IvyCraft brings reading, summarizing, designing, and repurposing into one flow. That is its strongest quality.
Visual IQ is Better than Expected: The infographic and comic tools are not just decorative. They often organize ideas in a way that makes sense.
Source Tracing Builds Trust: Being able to click back to original material reduces the “black box” feeling that comes with many AI tools.
Good for Repurposing: One source can become a deck, podcast, short video, and visual summary.
Cons
Video Still Works Best for Short Content: It is useful for clips and explainers, but not yet a full replacement for long-form video production.
The Workspace Model Takes Adjustment: Users coming from ChatGPT may expect to start typing immediately. IvyCraft works better when sources are uploaded first.
Visual Exports May Need Cleanup: Dense infographics and slides can require manual spacing fixes before final use.
Pricing And Value
IvyCraft’s value depends on how many tools it replaces. A typical content or research workflow may involve Canva Pro, ChatGPT Plus, NotebookLM, a video tool, a podcast tool, and a slide generator. Even if some of those tools are free, the workflow still costs time and attention.
Basic: $7.00/month with 10,000 tokens
Pro: $14.00/month with 20,000 tokens
Max: $70.00/month with 100,000 tokens
Who Is IvyCraft For?
Good Fit
Researchers and Analysts who need to turn dense source material into visual briefs, slides, or summaries.
Educators who want to make lessons more engaging by converting chapters or videos into comics, quizzes, storyboards, or audio material.
Content Marketers who need to repurpose one webinar, report, or podcast into multiple pieces of content.
Consultants who regularly turn research into decks, client summaries, and visual explanations.
Bad Fit
Coders who need advanced code execution, debugging, or notebook-style computation.
Users Who Only Need Simple Chat may find the workspace model more than they need.
FAQ
Is IvyCraft Better Than NotebookLM?
It depends on the use case. NotebookLM is excellent for source Q&A and audio overviews. IvyCraft is stronger when users need multiple output formats, such as slides, infographics, comics, podcasts, posters, and videos. It is better for creation, not just study.
Can IvyCraft Generate AI Podcasts From My PDF?
Yes. IvyCraft can use uploaded source material, such as PDFs, to generate podcast-style scripts or audio content. This is useful for turning long reports or research documents into easier listening formats.
Is The Infographic Export High Resolution?
IvyCraft’s infographic output is usable for presentations, internal reports, teaching material, and social content. Complex visuals may still need light editing, especially when the source material is dense.
Does IvyCraft Hallucinate Facts?
IvyCraft reduces hallucination risk by grounding outputs in uploaded sources and offering traceability. That does not mean users should skip review. It means fact-checking is much easier because claims can be traced back to the original material.
Can I Edit the Slides After AI Generates Them?
Yes. IvyCraft-generated slides can be adjusted after creation. In practice, most decks still benefit from light editing before presentation, especially around wording, spacing, and visual emphasis.
The Verdict
IvyCraft earns a strong 4.5 out of 5. It is not just a chat wrapper. The platform understands something many AI tools still miss: knowledge work does not stop at summarization. Most professionals need to explain, present, teach, publish, or repurpose what they learn. That is where IvyCraft stands out. It connects source understanding with content creation, and it does so across formats that usually require several tools. It still has rough edges. Some features might need improvement, but the direction is right. For anyone tired of copying text between AI tools, design apps, slide generators, and audio tools, IvyCraft feels like a serious step forward. Stop switching tabs. Start crafting. Try IvyCraft for free!
Source link
#IvyCraft #Review #Workspace #Infographics #Video #Podcasts
#49ers #coach #Tesla #Autopilot #crashedElectric Cars,Entertainment,News,Sports,Tesla,Transportation">49ers coach says his Tesla was on Autopilot when he crashed
“I’ve had Autopilot for nine years, so I’m pretty comfortable with it and, you know, who knows what happened when I turned around? Whether it malfunctioned or whether I knocked it off? That’s something I don’t know yet. But regardless, that’s… it is always your fault, whether you’re on Autopilot or not. You can’t take your eyes off the road. It’s a partnership driving, you don’t just turn it over to a computer.”
Mixed in with the new developments are trendy food spots like Hoppers and BAO. Hop a train from King’s Cross, and founders can be in Cambridge in 45 minutes to source talent or can be in Paris in two hours to strike a deal.
Who would have guessed that a little more than 20 years ago, this was one of the seediest areas in London?
“In the ’80s, crack and heroin made the area a major narcotics market,” Hussein Kanji, an investor at Hoxton Ventures, said, recalling syringes in tree trunks and gangs patrolling the streets. “In 1982, the local church was occupied by the English Collective of Prostitutes for 12 straight days.” Then, in the early 2000s, a real estate developer had a dream and, well, “now it is the AI hotbed of the United Kingdom,” Kanji said. “What a change.”
Around 18 months ago, his portfolio company BioCorteX moved from the neighborhood Holborn to the Jellicoe building in King’s Cross, hoping to be near the action. “Lots going on in London right now,” Nik Sharma, co-founder of BioCorteX, told me. “Lots of hyperscalers moving in.” That includes, reportedly, Jeff Bezos’ AI company Prometheus, which is also said to be in talks to move into the Jellicoe.
There are around 3,600 AI startups in London, which, together, have raised around $12.1 billion out of the $14.8 billion raised in the city since late July, according to Dealroom. Since the start of June, AI-related startups have leased more than 1 million square feet of office space in London, according to the real estate firm Knight Frank. With that, prime rents in King’s Cross have risen 18% over the past three years, Chris Dunn, a commercial insight associate at the firm, told me.
That percentage represents only the largest leases encompassing at least 10,000 square feet, like the ones OpenAI and Prometheus are signing. The shorter deals go for even more, he said, and now the vacancy rate for conventional office space is just 0.9%. “Demand has outstripped supply,” he continued.
Today, one of the big topics of the area is sovereignty. It was a wake-up call for many when Anthropic shut off access to Mythos and Fable this summer, leaving some in the ecosystem to conclude: “We’d better look after ourselves,” Saul Klein, co-founder of the VC firm Phoenix Court, told me.
Phoenix Court is located in the King’s Cross area and has three portfolio companies in the vicinity, including Olix (which just announced a $3.3 billion valuation), Early Health and CoMind. Robin Klein, co-founder of the firm, said the shutdown of Fable and Mythos access was a “small but sharp reminder that Europe can’t simply rent its AI capabilities and capacity; it needs to build and hold some of its own.” King’s Cross, he said, is where much of this building is actually happening.
“The bigger question,” he continued, “is whether the U.K. builds the infrastructure, compute, energy, capital, to make this self-reliance durable, rather than just hosting outposts of U.S. labs.”
Image Credits:Phoenix Court
Top founders want to stay
Simon Kohl, founder of Latent Labs, has offices in King’s Cross and San Francisco. The London office, at the moment, is growing faster, and he’s more bullish than ever on the ecosystem, he said. “The mood right now feels less like London trying to catch up and more like London becoming one of the default places to start a serious AI company,” he said.
Look around and you are likely to see Wayve testing its autonomous cars. Founded in 2017 by co-founder Alex Kendall, the unicorn is one of London’s biggest success stories.
“Ten years ago, building a frontier AI company from London felt like an unusual choice,” Kendall told me. “Now it feels like an obvious one.” Wayve moved into King’s Cross in 2018 looking for a space that could double as a garage — “a rare combination in Central London,” Kendall said. He has watched the ecosystem mature around him — and it’s now evident that a startup can stay in London, raise serious capital, hire world-class AI talent, and remain globally competitive, he said.
Down the street from Anthropic’s new 158,000-square-foot office is the AI agent builder Sierra and the AI video platform Synthesia.
Laura Gonzalez Florez, Synthesia’s chief of staff and head of people, says the company moved into its glossy new office building a year ago to accommodate its growing team. They were drawn to the area for the same reason as everyone else: “It’s very close to the airport … very close to where a lot of investors are,” she said.
Image Credits:Synthesia
Around two-thirds of Synthesia’s engineers are remote, Gonzalez Florez said, letting the company tap into an affordable, international, and diverse talent pool and helping it scale faster. “From London, we can hire and work, without any problem, people from anywhere, from Slovenia to Portugal,” she said.
Unsurprisingly, London’s AI boom is also causing a talent war.
U.K. AI job postings have skyrocketed in the past few years, per data from PwC. When Anthropic announced it moved into town earlier this year, it listed, for example, a salary range of £260,000 to £630,000 for a machine learning research engineer when the average salary in London for the same role is around £102,000. Some founders in the U.K., like those in Silicon Valley, are being forced to raise more and bigger rounds to keep up.
“The real test is whether more globally significant AI companies are founded, funded, and scaled from the U.K., while continuing to attract the world’s best talent to build them here,” Zain Ali, founder of the King’s Cross-based AI legal firm Centuro, told me. “If that continues to happen, King’s Cross won’t just be an AI hub. It’ll become one of the U.K.’s most important strategic assets.”
When you purchase through links in our articles, we may earn a small commission. This doesn’t affect our editorial independence.
Mixed in with the new developments are trendy food spots like Hoppers and BAO. Hop a train from King’s Cross, and founders can be in Cambridge in 45 minutes to source talent or can be in Paris in two hours to strike a deal.
Who would have guessed that a little more than 20 years ago, this was one of the seediest areas in London?
“In the ’80s, crack and heroin made the area a major narcotics market,” Hussein Kanji, an investor at Hoxton Ventures, said, recalling syringes in tree trunks and gangs patrolling the streets. “In 1982, the local church was occupied by the English Collective of Prostitutes for 12 straight days.” Then, in the early 2000s, a real estate developer had a dream and, well, “now it is the AI hotbed of the United Kingdom,” Kanji said. “What a change.”
Around 18 months ago, his portfolio company BioCorteX moved from the neighborhood Holborn to the Jellicoe building in King’s Cross, hoping to be near the action. “Lots going on in London right now,” Nik Sharma, co-founder of BioCorteX, told me. “Lots of hyperscalers moving in.” That includes, reportedly, Jeff Bezos’ AI company Prometheus, which is also said to be in talks to move into the Jellicoe.
There are around 3,600 AI startups in London, which, together, have raised around $12.1 billion out of the $14.8 billion raised in the city since late July, according to Dealroom. Since the start of June, AI-related startups have leased more than 1 million square feet of office space in London, according to the real estate firm Knight Frank. With that, prime rents in King’s Cross have risen 18% over the past three years, Chris Dunn, a commercial insight associate at the firm, told me.
That percentage represents only the largest leases encompassing at least 10,000 square feet, like the ones OpenAI and Prometheus are signing. The shorter deals go for even more, he said, and now the vacancy rate for conventional office space is just 0.9%. “Demand has outstripped supply,” he continued.
Today, one of the big topics of the area is sovereignty. It was a wake-up call for many when Anthropic shut off access to Mythos and Fable this summer, leaving some in the ecosystem to conclude: “We’d better look after ourselves,” Saul Klein, co-founder of the VC firm Phoenix Court, told me.
Phoenix Court is located in the King’s Cross area and has three portfolio companies in the vicinity, including Olix (which just announced a $3.3 billion valuation), Early Health and CoMind. Robin Klein, co-founder of the firm, said the shutdown of Fable and Mythos access was a “small but sharp reminder that Europe can’t simply rent its AI capabilities and capacity; it needs to build and hold some of its own.” King’s Cross, he said, is where much of this building is actually happening.
“The bigger question,” he continued, “is whether the U.K. builds the infrastructure, compute, energy, capital, to make this self-reliance durable, rather than just hosting outposts of U.S. labs.”
Image Credits:Phoenix Court
Top founders want to stay
Simon Kohl, founder of Latent Labs, has offices in King’s Cross and San Francisco. The London office, at the moment, is growing faster, and he’s more bullish than ever on the ecosystem, he said. “The mood right now feels less like London trying to catch up and more like London becoming one of the default places to start a serious AI company,” he said.
Look around and you are likely to see Wayve testing its autonomous cars. Founded in 2017 by co-founder Alex Kendall, the unicorn is one of London’s biggest success stories.
“Ten years ago, building a frontier AI company from London felt like an unusual choice,” Kendall told me. “Now it feels like an obvious one.” Wayve moved into King’s Cross in 2018 looking for a space that could double as a garage — “a rare combination in Central London,” Kendall said. He has watched the ecosystem mature around him — and it’s now evident that a startup can stay in London, raise serious capital, hire world-class AI talent, and remain globally competitive, he said.
Down the street from Anthropic’s new 158,000-square-foot office is the AI agent builder Sierra and the AI video platform Synthesia.
Laura Gonzalez Florez, Synthesia’s chief of staff and head of people, says the company moved into its glossy new office building a year ago to accommodate its growing team. They were drawn to the area for the same reason as everyone else: “It’s very close to the airport … very close to where a lot of investors are,” she said.
Image Credits:Synthesia
Around two-thirds of Synthesia’s engineers are remote, Gonzalez Florez said, letting the company tap into an affordable, international, and diverse talent pool and helping it scale faster. “From London, we can hire and work, without any problem, people from anywhere, from Slovenia to Portugal,” she said.
Unsurprisingly, London’s AI boom is also causing a talent war.
U.K. AI job postings have skyrocketed in the past few years, per data from PwC. When Anthropic announced it moved into town earlier this year, it listed, for example, a salary range of £260,000 to £630,000 for a machine learning research engineer when the average salary in London for the same role is around £102,000. Some founders in the U.K., like those in Silicon Valley, are being forced to raise more and bigger rounds to keep up.
“The real test is whether more globally significant AI companies are founded, funded, and scaled from the U.K., while continuing to attract the world’s best talent to build them here,” Zain Ali, founder of the King’s Cross-based AI legal firm Centuro, told me. “If that continues to happen, King’s Cross won’t just be an AI hub. It’ll become one of the U.K.’s most important strategic assets.”
When you purchase through links in our articles, we may earn a small commission. This doesn’t affect our editorial independence.
#Thisformernotorious #redlight #districtis #nowone #worlds #top #hubs #TechCrunchUK">This former notorious red-light district is now one of the world’s top AI hubs | TechCrunch
What every U.K. AI startup wants to know these days is, how can I get office space in King’s Cross?
The area is so hot that a VC firm allegedly recently won a deal by promising a founder office space in the neighborhood. “We stop at nothing to win deals [for] and to support” founders, “including helping them source office space when needed,” the firm told me when asked about the rumor, declining to confirm or deny any details.
The neighborhood’s popularity began back in 2016 when DeepMind — then newly acquired by Google — moved in. Soon after, a flood of AI startups followed, wanting to be around the Google DeepMind magic. Today, they hope to take advantage of the cluster of AI talent there.
This has transformed King’s Cross into one of the world’s top AI hubs, rivaled only by San Francisco and Beijing. Around London, it’s known by the sobriquet “Knowledge Quarter,” as it’s home to names like OpenAI, Meta, Isomorphic Labs, Cusp AI, Wayne, Recursive, and, a little farther down the road, Synthesia and Anthropic. The European Technology Network (ETN) just moved into a glossy new office nearby, while University College London sits around the corner.
Mixed in with the new developments are trendy food spots like Hoppers and BAO. Hop a train from King’s Cross, and founders can be in Cambridge in 45 minutes to source talent or can be in Paris in two hours to strike a deal.
Who would have guessed that a little more than 20 years ago, this was one of the seediest areas in London?
“In the ’80s, crack and heroin made the area a major narcotics market,” Hussein Kanji, an investor at Hoxton Ventures, said, recalling syringes in tree trunks and gangs patrolling the streets. “In 1982, the local church was occupied by the English Collective of Prostitutes for 12 straight days.” Then, in the early 2000s, a real estate developer had a dream and, well, “now it is the AI hotbed of the United Kingdom,” Kanji said. “What a change.”
Around 18 months ago, his portfolio company BioCorteX moved from the neighborhood Holborn to the Jellicoe building in King’s Cross, hoping to be near the action. “Lots going on in London right now,” Nik Sharma, co-founder of BioCorteX, told me. “Lots of hyperscalers moving in.” That includes, reportedly, Jeff Bezos’ AI company Prometheus, which is also said to be in talks to move into the Jellicoe.
There are around 3,600 AI startups in London, which, together, have raised around $12.1 billion out of the $14.8 billion raised in the city since late July, according to Dealroom. Since the start of June, AI-related startups have leased more than 1 million square feet of office space in London, according to the real estate firm Knight Frank. With that, prime rents in King’s Cross have risen 18% over the past three years, Chris Dunn, a commercial insight associate at the firm, told me.
That percentage represents only the largest leases encompassing at least 10,000 square feet, like the ones OpenAI and Prometheus are signing. The shorter deals go for even more, he said, and now the vacancy rate for conventional office space is just 0.9%. “Demand has outstripped supply,” he continued.
Today, one of the big topics of the area is sovereignty. It was a wake-up call for many when Anthropic shut off access to Mythos and Fable this summer, leaving some in the ecosystem to conclude: “We’d better look after ourselves,” Saul Klein, co-founder of the VC firm Phoenix Court, told me.
Phoenix Court is located in the King’s Cross area and has three portfolio companies in the vicinity, including Olix (which just announced a $3.3 billion valuation), Early Health and CoMind. Robin Klein, co-founder of the firm, said the shutdown of Fable and Mythos access was a “small but sharp reminder that Europe can’t simply rent its AI capabilities and capacity; it needs to build and hold some of its own.” King’s Cross, he said, is where much of this building is actually happening.
“The bigger question,” he continued, “is whether the U.K. builds the infrastructure, compute, energy, capital, to make this self-reliance durable, rather than just hosting outposts of U.S. labs.”
Image Credits:Phoenix Court
Top founders want to stay
Simon Kohl, founder of Latent Labs, has offices in King’s Cross and San Francisco. The London office, at the moment, is growing faster, and he’s more bullish than ever on the ecosystem, he said. “The mood right now feels less like London trying to catch up and more like London becoming one of the default places to start a serious AI company,” he said.
Look around and you are likely to see Wayve testing its autonomous cars. Founded in 2017 by co-founder Alex Kendall, the unicorn is one of London’s biggest success stories.
“Ten years ago, building a frontier AI company from London felt like an unusual choice,” Kendall told me. “Now it feels like an obvious one.” Wayve moved into King’s Cross in 2018 looking for a space that could double as a garage — “a rare combination in Central London,” Kendall said. He has watched the ecosystem mature around him — and it’s now evident that a startup can stay in London, raise serious capital, hire world-class AI talent, and remain globally competitive, he said.
Down the street from Anthropic’s new 158,000-square-foot office is the AI agent builder Sierra and the AI video platform Synthesia.
Laura Gonzalez Florez, Synthesia’s chief of staff and head of people, says the company moved into its glossy new office building a year ago to accommodate its growing team. They were drawn to the area for the same reason as everyone else: “It’s very close to the airport … very close to where a lot of investors are,” she said.
Image Credits:Synthesia
Around two-thirds of Synthesia’s engineers are remote, Gonzalez Florez said, letting the company tap into an affordable, international, and diverse talent pool and helping it scale faster. “From London, we can hire and work, without any problem, people from anywhere, from Slovenia to Portugal,” she said.
Unsurprisingly, London’s AI boom is also causing a talent war.
U.K. AI job postings have skyrocketed in the past few years, per data from PwC. When Anthropic announced it moved into town earlier this year, it listed, for example, a salary range of £260,000 to £630,000 for a machine learning research engineer when the average salary in London for the same role is around £102,000. Some founders in the U.K., like those in Silicon Valley, are being forced to raise more and bigger rounds to keep up.
“The real test is whether more globally significant AI companies are founded, funded, and scaled from the U.K., while continuing to attract the world’s best talent to build them here,” Zain Ali, founder of the King’s Cross-based AI legal firm Centuro, told me. “If that continues to happen, King’s Cross won’t just be an AI hub. It’ll become one of the U.K.’s most important strategic assets.”
When you purchase through links in our articles, we may earn a small commission. This doesn’t affect our editorial independence.
Every step you take closes the doors that the attacker may open slightly, and when you combine everything, you would have a door to a series of locked gates.
Why Do I Need a Bastion Host?
When it comes to teams working with many servers, deploying a bastion host (jump box) may be a clean and effective way to solve the long-term problem. With this method, you only expose SSH to the bastion, and the other servers accept it only when it’s from the bastion’s internal IP. This centralizes logging and makes auditing access far simpler.
Using a virtual private network (VPN) and a bastion host together is perfectly fine – and many solutions use both: a safe way to access the private network via a VPN, followed by use of a bastion host to restrict which servers can be accessed. Some teams may decide to forgo the bastion because they don’t have the manpower to manage one, and so use a combination of a VPN and a set of firewall rules that still quite a bit lowers the exposure, but without the extra effort.
Mistakes Leading to Leaving Cloud Servers Open
The Mistakes That Cause Leaving Cloud Servers Open: Even the safest development teams may have slip-ups from time to time. One of the most frequent is leaving staged, or test servers with relaxed firewall rules equivalent to those of the production environment – hackers don’t concern themselves with which environment they first land on. Another frequent error is reusing the same SSH key on several servers and clients, causing one hacked laptop to compromise all servers that key has access to.
Another common human error is not removing or changing access when someone leaves the team, so stale credentials remain valid and accessible. At last, putting trust in the strategy of “security through obscurity” – meaning one thinks that setting up the unusual port or hiding the hostname from the public is actually sufficient security – creates a wrong impression of security. This is mostly true; in reality, modern-day attackers scan all ports anyway, and there is no way to hide from them.
System Administrators Guide to Secure Remote Access
Prohibit SSH password logins totally and depend exclusively on key-based authentication
Surely no one wants to type in the password every time; because of this, use only key-based authentication
Deter the user from logging in as root by default and instead use the sudo command to do root tasks
A firewall or security group rule can provide great help with IP address-based restrictions on SSH logins
For access that comes from untrusted sources or external networks, use a secure tunnel like a vpn or bastion host
Periodically change SSH keys and inspect access lists
Maintain records of login attempts and detect brute-force attacks as quickly as possible
Frequently Asked Questions
What is the principal means by which cloud servers suffer break-ins through remote access?
By far the biggest reason why this can happen is unauthorized password-based SSH logins that have been cracked by brute force. The scenario is most likely to develop where the administrator allows root login via password and leaves the default port open.
Sufficient security measures for the server via SSH keys: Do you think it is safe to rely only on key authentication?
It is true that SSH keys drastically decrease the danger of a successful brute-force attack. However, if there is only key authentication on the server, there are still risks – the server administrator can always enable root login or disable the IP-based login restrictions. So it is recommended to always have these three in the server configuration: disabled root login, restricted access to known IPs, and rotating the keys regularly as the main components of meaningful protection.
Is it really necessary to set up a separate VPN network while I am able to connect via SSH keys?
A VPN gives extra security by first encrypting your computer traffic before it reaches your network, where the SSH connection will be used. This is mostly important when working on untrusted networks – like public wi-fi – where there is a threat of a potential hacker in your local network looking at your data.
Bastion host vs VPN as methods of accessing the server?
The bastion host works by funneling SSH sessions from many users through a single, carefully monitored server point while the rest of the network (and mostly the servers) remains protected from the internet. At the same time, a vpn will fully encrypt the communication between the user and the corporate network or servers. The combination is very common among larger security teams as a part of the defense-in-depth principle.
How often should SSH keys be rotated?
The ideal period to change your SSH keys depends on the security practices of your organization, but generally a good practice is to change SSH keys between 90 and 180 days, or in the case that the user who had access with the key leaves or is no longer able to be contacted, such as when a team member leaves.
Why is only changing the port number for SSH enough to secure that port?
Changing the port reduces automated scanning noise in your logs but isn’t a real security control on its own — port scanners check all ports, so it should never replace key-based auth and firewall rules.
Every step you take closes the doors that the attacker may open slightly, and when you combine everything, you would have a door to a series of locked gates.
Why Do I Need a Bastion Host?
When it comes to teams working with many servers, deploying a bastion host (jump box) may be a clean and effective way to solve the long-term problem. With this method, you only expose SSH to the bastion, and the other servers accept it only when it’s from the bastion’s internal IP. This centralizes logging and makes auditing access far simpler.
Using a virtual private network (VPN) and a bastion host together is perfectly fine – and many solutions use both: a safe way to access the private network via a VPN, followed by use of a bastion host to restrict which servers can be accessed. Some teams may decide to forgo the bastion because they don’t have the manpower to manage one, and so use a combination of a VPN and a set of firewall rules that still quite a bit lowers the exposure, but without the extra effort.
Mistakes Leading to Leaving Cloud Servers Open
The Mistakes That Cause Leaving Cloud Servers Open: Even the safest development teams may have slip-ups from time to time. One of the most frequent is leaving staged, or test servers with relaxed firewall rules equivalent to those of the production environment – hackers don’t concern themselves with which environment they first land on. Another frequent error is reusing the same SSH key on several servers and clients, causing one hacked laptop to compromise all servers that key has access to.
Another common human error is not removing or changing access when someone leaves the team, so stale credentials remain valid and accessible. At last, putting trust in the strategy of “security through obscurity” – meaning one thinks that setting up the unusual port or hiding the hostname from the public is actually sufficient security – creates a wrong impression of security. This is mostly true; in reality, modern-day attackers scan all ports anyway, and there is no way to hide from them.
System Administrators Guide to Secure Remote Access
Prohibit SSH password logins totally and depend exclusively on key-based authentication
Surely no one wants to type in the password every time; because of this, use only key-based authentication
Deter the user from logging in as root by default and instead use the sudo command to do root tasks
A firewall or security group rule can provide great help with IP address-based restrictions on SSH logins
For access that comes from untrusted sources or external networks, use a secure tunnel like a vpn or bastion host
Periodically change SSH keys and inspect access lists
Maintain records of login attempts and detect brute-force attacks as quickly as possible
Frequently Asked Questions
What is the principal means by which cloud servers suffer break-ins through remote access?
By far the biggest reason why this can happen is unauthorized password-based SSH logins that have been cracked by brute force. The scenario is most likely to develop where the administrator allows root login via password and leaves the default port open.
Sufficient security measures for the server via SSH keys: Do you think it is safe to rely only on key authentication?
It is true that SSH keys drastically decrease the danger of a successful brute-force attack. However, if there is only key authentication on the server, there are still risks – the server administrator can always enable root login or disable the IP-based login restrictions. So it is recommended to always have these three in the server configuration: disabled root login, restricted access to known IPs, and rotating the keys regularly as the main components of meaningful protection.
Is it really necessary to set up a separate VPN network while I am able to connect via SSH keys?
A VPN gives extra security by first encrypting your computer traffic before it reaches your network, where the SSH connection will be used. This is mostly important when working on untrusted networks – like public wi-fi – where there is a threat of a potential hacker in your local network looking at your data.
Bastion host vs VPN as methods of accessing the server?
The bastion host works by funneling SSH sessions from many users through a single, carefully monitored server point while the rest of the network (and mostly the servers) remains protected from the internet. At the same time, a vpn will fully encrypt the communication between the user and the corporate network or servers. The combination is very common among larger security teams as a part of the defense-in-depth principle.
How often should SSH keys be rotated?
The ideal period to change your SSH keys depends on the security practices of your organization, but generally a good practice is to change SSH keys between 90 and 180 days, or in the case that the user who had access with the key leaves or is no longer able to be contacted, such as when a team member leaves.
Why is only changing the port number for SSH enough to secure that port?
Changing the port reduces automated scanning noise in your logs but isn’t a real security control on its own — port scanners check all ports, so it should never replace key-based auth and firewall rules.
#Secure #Remote #Access #Cloud #ServerCloud,remote access">How to Secure Remote Access to Your Cloud Server in 2026
Protection against unauthorized remote logins to your cloud server is a matter of SSH key-based authentication, a strict security policy on the firewall, two-factor authentication, and a secure communication channel – no individual component will give adequate protection by itself. The major risk point in breaches is not the server but the open door to remote login. To patch that vulnerability, you need a series of countermeasures, not a magical setting.
Why Remote Server Access Is a Common Attack Vector
Every cloud server exposes at least one remote access point – usually SSH on port 22 – and that port is scanned constantly by bots looking for weak credentials. Password-based login is the most common way a system can be attacked by brute force, and it is quite common with a standard setup that the system is left in a state where an admin/user of that system – “root user” – can log in directly by guessing the user ID and the password combination. Add in shared team credentials, forgotten firewall rules from old projects, and staging servers left publicly reachable, and it’s clear why misconfigured remote access – not zero-day exploits – is behind most cloud server compromises. The fix is simple, though you’ll need to do some setup yourself instead of trusting the default setting.
How to lock down SSH access in the right way
The best way to secure remote access is through a series of small improvements rather than one major overhaul. The following is a real working method:
Switch to SSH key authentication, then turn off password login completely in the same location: sshd_config. Keys are far harder to brute-force than passwords.
Disable root login over SSH and require a non-root user with sudo privileges instead; this is a security advantage that even without any change, one key compromising would limit the impact.
Change the default SSH port away from 22 to cut down on automated scanning noise (not a security measure on its own, but it reduces log clutter).
Restrict access by IP using your firewall or security group, allowing SSH only from known office or VPN IP ranges rather than the entire internet.
Add a VPN as a connection layer for anyone accessing servers from outside a trusted network – a VPN like Planet VPN’s free VPN service can encrypt the connection between a remote worker’s laptop and the server before SSH traffic ever leaves their device, which matters especially on public wi-fi or shared networks.
Every step you take closes the doors that the attacker may open slightly, and when you combine everything, you would have a door to a series of locked gates.
Why Do I Need a Bastion Host?
When it comes to teams working with many servers, deploying a bastion host (jump box) may be a clean and effective way to solve the long-term problem. With this method, you only expose SSH to the bastion, and the other servers accept it only when it’s from the bastion’s internal IP. This centralizes logging and makes auditing access far simpler.
Using a virtual private network (VPN) and a bastion host together is perfectly fine – and many solutions use both: a safe way to access the private network via a VPN, followed by use of a bastion host to restrict which servers can be accessed. Some teams may decide to forgo the bastion because they don’t have the manpower to manage one, and so use a combination of a VPN and a set of firewall rules that still quite a bit lowers the exposure, but without the extra effort.
Mistakes Leading to Leaving Cloud Servers Open
The Mistakes That Cause Leaving Cloud Servers Open: Even the safest development teams may have slip-ups from time to time. One of the most frequent is leaving staged, or test servers with relaxed firewall rules equivalent to those of the production environment – hackers don’t concern themselves with which environment they first land on. Another frequent error is reusing the same SSH key on several servers and clients, causing one hacked laptop to compromise all servers that key has access to.
Another common human error is not removing or changing access when someone leaves the team, so stale credentials remain valid and accessible. At last, putting trust in the strategy of “security through obscurity” – meaning one thinks that setting up the unusual port or hiding the hostname from the public is actually sufficient security – creates a wrong impression of security. This is mostly true; in reality, modern-day attackers scan all ports anyway, and there is no way to hide from them.
System Administrators Guide to Secure Remote Access
Prohibit SSH password logins totally and depend exclusively on key-based authentication
Surely no one wants to type in the password every time; because of this, use only key-based authentication
Deter the user from logging in as root by default and instead use the sudo command to do root tasks
A firewall or security group rule can provide great help with IP address-based restrictions on SSH logins
For access that comes from untrusted sources or external networks, use a secure tunnel like a vpn or bastion host
Periodically change SSH keys and inspect access lists
Maintain records of login attempts and detect brute-force attacks as quickly as possible
Frequently Asked Questions
What is the principal means by which cloud servers suffer break-ins through remote access?
By far the biggest reason why this can happen is unauthorized password-based SSH logins that have been cracked by brute force. The scenario is most likely to develop where the administrator allows root login via password and leaves the default port open.
Sufficient security measures for the server via SSH keys: Do you think it is safe to rely only on key authentication?
It is true that SSH keys drastically decrease the danger of a successful brute-force attack. However, if there is only key authentication on the server, there are still risks – the server administrator can always enable root login or disable the IP-based login restrictions. So it is recommended to always have these three in the server configuration: disabled root login, restricted access to known IPs, and rotating the keys regularly as the main components of meaningful protection.
Is it really necessary to set up a separate VPN network while I am able to connect via SSH keys?
A VPN gives extra security by first encrypting your computer traffic before it reaches your network, where the SSH connection will be used. This is mostly important when working on untrusted networks – like public wi-fi – where there is a threat of a potential hacker in your local network looking at your data.
Bastion host vs VPN as methods of accessing the server?
The bastion host works by funneling SSH sessions from many users through a single, carefully monitored server point while the rest of the network (and mostly the servers) remains protected from the internet. At the same time, a vpn will fully encrypt the communication between the user and the corporate network or servers. The combination is very common among larger security teams as a part of the defense-in-depth principle.
How often should SSH keys be rotated?
The ideal period to change your SSH keys depends on the security practices of your organization, but generally a good practice is to change SSH keys between 90 and 180 days, or in the case that the user who had access with the key leaves or is no longer able to be contacted, such as when a team member leaves.
Why is only changing the port number for SSH enough to secure that port?
Changing the port reduces automated scanning noise in your logs but isn’t a real security control on its own — port scanners check all ports, so it should never replace key-based auth and firewall rules.


![This former notorious red-light district is now one of the world’s top AI hubs | TechCrunch
What every U.K. AI startup wants to know these days is, how can I get office space in King’s Cross?
The area is so hot that a VC firm allegedly recently won a deal by promising a founder office space in the neighborhood. “We stop at nothing to win deals [for] and to support” founders, “including helping them source office space when needed,” the firm told me when asked about the rumor, declining to confirm or deny any details.
The neighborhood’s popularity began back in 2016 when DeepMind — then newly acquired by Google — moved in. Soon after, a flood of AI startups followed, wanting to be around the Google DeepMind magic. Today, they hope to take advantage of the cluster of AI talent there.
This has transformed King’s Cross into one of the world’s top AI hubs, rivaled only by San Francisco and Beijing. Around London, it’s known by the sobriquet “Knowledge Quarter,” as it’s home to names like OpenAI, Meta, Isomorphic Labs, Cusp AI, Wayne, Recursive, and, a little farther down the road, Synthesia and Anthropic. The European Technology Network (ETN) just moved into a glossy new office nearby, while University College London sits around the corner.
Mixed in with the new developments are trendy food spots like Hoppers and BAO. Hop a train from King’s Cross, and founders can be in Cambridge in 45 minutes to source talent or can be in Paris in two hours to strike a deal.
Who would have guessed that a little more than 20 years ago, this was one of the seediest areas in London?
“In the ’80s, crack and heroin made the area a major narcotics market,” Hussein Kanji, an investor at Hoxton Ventures, said, recalling syringes in tree trunks and gangs patrolling the streets. “In 1982, the local church was occupied by the English Collective of Prostitutes for 12 straight days.” Then, in the early 2000s, a real estate developer had a dream and, well, “now it is the AI hotbed of the United Kingdom,” Kanji said. “What a change.” Around 18 months ago, his portfolio company BioCorteX moved from the neighborhood Holborn to the Jellicoe building in King’s Cross, hoping to be near the action. “Lots going on in London right now,” Nik Sharma, co-founder of BioCorteX, told me. “Lots of hyperscalers moving in.” That includes, reportedly, Jeff Bezos’ AI company Prometheus, which is also said to be in talks to move into the Jellicoe.
There are around 3,600 AI startups in London, which, together, have raised around .1 billion out of the .8 billion raised in the city since late July, according to Dealroom. Since the start of June, AI-related startups have leased more than 1 million square feet of office space in London, according to the real estate firm Knight Frank. With that, prime rents in King’s Cross have risen 18% over the past three years, Chris Dunn, a commercial insight associate at the firm, told me. That percentage represents only the largest leases encompassing at least 10,000 square feet, like the ones OpenAI and Prometheus are signing. The shorter deals go for even more, he said, and now the vacancy rate for conventional office space is just 0.9%. “Demand has outstripped supply,” he continued.
Today, one of the big topics of the area is sovereignty. It was a wake-up call for many when Anthropic shut off access to Mythos and Fable this summer, leaving some in the ecosystem to conclude: “We’d better look after ourselves,” Saul Klein, co-founder of the VC firm Phoenix Court, told me.
Phoenix Court is located in the King’s Cross area and has three portfolio companies in the vicinity, including Olix (which just announced a .3 billion valuation), Early Health and CoMind. Robin Klein, co-founder of the firm, said the shutdown of Fable and Mythos access was a “small but sharp reminder that Europe can’t simply rent its AI capabilities and capacity; it needs to build and hold some of its own.” King’s Cross, he said, is where much of this building is actually happening.
“The bigger question,” he continued, “is whether the U.K. builds the infrastructure, compute, energy, capital, to make this self-reliance durable, rather than just hosting outposts of U.S. labs.”
Image Credits:Phoenix Court
Top founders want to stay
Simon Kohl, founder of Latent Labs, has offices in King’s Cross and San Francisco. The London office, at the moment, is growing faster, and he’s more bullish than ever on the ecosystem, he said. “The mood right now feels less like London trying to catch up and more like London becoming one of the default places to start a serious AI company,” he said. Look around and you are likely to see Wayve testing its autonomous cars. Founded in 2017 by co-founder Alex Kendall, the unicorn is one of London’s biggest success stories.
“Ten years ago, building a frontier AI company from London felt like an unusual choice,” Kendall told me. “Now it feels like an obvious one.” Wayve moved into King’s Cross in 2018 looking for a space that could double as a garage — “a rare combination in Central London,” Kendall said. He has watched the ecosystem mature around him — and it’s now evident that a startup can stay in London, raise serious capital, hire world-class AI talent, and remain globally competitive, he said. Down the street from Anthropic’s new 158,000-square-foot office is the AI agent builder Sierra and the AI video platform Synthesia.
Laura Gonzalez Florez, Synthesia’s chief of staff and head of people, says the company moved into its glossy new office building a year ago to accommodate its growing team. They were drawn to the area for the same reason as everyone else: “It’s very close to the airport … very close to where a lot of investors are,” she said.
Image Credits:Synthesia
Around two-thirds of Synthesia’s engineers are remote, Gonzalez Florez said, letting the company tap into an affordable, international, and diverse talent pool and helping it scale faster. “From London, we can hire and work, without any problem, people from anywhere, from Slovenia to Portugal,” she said.
Unsurprisingly, London’s AI boom is also causing a talent war.U.K. AI job postings have skyrocketed in the past few years, per data from PwC. When Anthropic announced it moved into town earlier this year, it listed, for example, a salary range of £260,000 to £630,000 for a machine learning research engineer when the average salary in London for the same role is around £102,000. Some founders in the U.K., like those in Silicon Valley, are being forced to raise more and bigger rounds to keep up.
“The real test is whether more globally significant AI companies are founded, funded, and scaled from the U.K., while continuing to attract the world’s best talent to build them here,” Zain Ali, founder of the King’s Cross-based AI legal firm Centuro, told me. “If that continues to happen, King’s Cross won’t just be an AI hub. It’ll become one of the U.K.’s most important strategic assets.”
When you purchase through links in our articles, we may earn a small commission. This doesn’t affect our editorial independence.#Thisformernotorious #redlight #districtis #nowone #worlds #top #hubs #TechCrunchUK](https://techcrunch.com/wp-content/uploads/2026/08/DM9A2852.jpg?w=680 "This former notorious red-light district is now one of the world’s top AI hubs | TechCrunch
What every U.K. AI startup wants to know these days is, how can I get office space in King’s Cross?
The area is so hot that a VC firm allegedly recently won a deal by promising a founder office space in the neighborhood. “We stop at nothing to win deals [for] and to support” founders, “including helping them source office space when needed,” the firm told me when asked about the rumor, declining to confirm or deny any details.
The neighborhood’s popularity began back in 2016 when DeepMind — then newly acquired by Google — moved in. Soon after, a flood of AI startups followed, wanting to be around the Google DeepMind magic. Today, they hope to take advantage of the cluster of AI talent there.
This has transformed King’s Cross into one of the world’s top AI hubs, rivaled only by San Francisco and Beijing. Around London, it’s known by the sobriquet “Knowledge Quarter,” as it’s home to names like OpenAI, Meta, Isomorphic Labs, Cusp AI, Wayne, Recursive, and, a little farther down the road, Synthesia and Anthropic. The European Technology Network (ETN) just moved into a glossy new office nearby, while University College London sits around the corner.
Mixed in with the new developments are trendy food spots like Hoppers and BAO. Hop a train from King’s Cross, and founders can be in Cambridge in 45 minutes to source talent or can be in Paris in two hours to strike a deal.
Who would have guessed that a little more than 20 years ago, this was one of the seediest areas in London?
“In the ’80s, crack and heroin made the area a major narcotics market,” Hussein Kanji, an investor at Hoxton Ventures, said, recalling syringes in tree trunks and gangs patrolling the streets. “In 1982, the local church was occupied by the English Collective of Prostitutes for 12 straight days.” Then, in the early 2000s, a real estate developer had a dream and, well, “now it is the AI hotbed of the United Kingdom,” Kanji said. “What a change.” Around 18 months ago, his portfolio company BioCorteX moved from the neighborhood Holborn to the Jellicoe building in King’s Cross, hoping to be near the action. “Lots going on in London right now,” Nik Sharma, co-founder of BioCorteX, told me. “Lots of hyperscalers moving in.” That includes, reportedly, Jeff Bezos’ AI company Prometheus, which is also said to be in talks to move into the Jellicoe.
There are around 3,600 AI startups in London, which, together, have raised around .1 billion out of the .8 billion raised in the city since late July, according to Dealroom. Since the start of June, AI-related startups have leased more than 1 million square feet of office space in London, according to the real estate firm Knight Frank. With that, prime rents in King’s Cross have risen 18% over the past three years, Chris Dunn, a commercial insight associate at the firm, told me. That percentage represents only the largest leases encompassing at least 10,000 square feet, like the ones OpenAI and Prometheus are signing. The shorter deals go for even more, he said, and now the vacancy rate for conventional office space is just 0.9%. “Demand has outstripped supply,” he continued.
Today, one of the big topics of the area is sovereignty. It was a wake-up call for many when Anthropic shut off access to Mythos and Fable this summer, leaving some in the ecosystem to conclude: “We’d better look after ourselves,” Saul Klein, co-founder of the VC firm Phoenix Court, told me.
Phoenix Court is located in the King’s Cross area and has three portfolio companies in the vicinity, including Olix (which just announced a .3 billion valuation), Early Health and CoMind. Robin Klein, co-founder of the firm, said the shutdown of Fable and Mythos access was a “small but sharp reminder that Europe can’t simply rent its AI capabilities and capacity; it needs to build and hold some of its own.” King’s Cross, he said, is where much of this building is actually happening.
“The bigger question,” he continued, “is whether the U.K. builds the infrastructure, compute, energy, capital, to make this self-reliance durable, rather than just hosting outposts of U.S. labs.”
Image Credits:Phoenix Court
Top founders want to stay
Simon Kohl, founder of Latent Labs, has offices in King’s Cross and San Francisco. The London office, at the moment, is growing faster, and he’s more bullish than ever on the ecosystem, he said. “The mood right now feels less like London trying to catch up and more like London becoming one of the default places to start a serious AI company,” he said. Look around and you are likely to see Wayve testing its autonomous cars. Founded in 2017 by co-founder Alex Kendall, the unicorn is one of London’s biggest success stories.
“Ten years ago, building a frontier AI company from London felt like an unusual choice,” Kendall told me. “Now it feels like an obvious one.” Wayve moved into King’s Cross in 2018 looking for a space that could double as a garage — “a rare combination in Central London,” Kendall said. He has watched the ecosystem mature around him — and it’s now evident that a startup can stay in London, raise serious capital, hire world-class AI talent, and remain globally competitive, he said. Down the street from Anthropic’s new 158,000-square-foot office is the AI agent builder Sierra and the AI video platform Synthesia.
Laura Gonzalez Florez, Synthesia’s chief of staff and head of people, says the company moved into its glossy new office building a year ago to accommodate its growing team. They were drawn to the area for the same reason as everyone else: “It’s very close to the airport … very close to where a lot of investors are,” she said.
Image Credits:Synthesia
Around two-thirds of Synthesia’s engineers are remote, Gonzalez Florez said, letting the company tap into an affordable, international, and diverse talent pool and helping it scale faster. “From London, we can hire and work, without any problem, people from anywhere, from Slovenia to Portugal,” she said.
Unsurprisingly, London’s AI boom is also causing a talent war.U.K. AI job postings have skyrocketed in the past few years, per data from PwC. When Anthropic announced it moved into town earlier this year, it listed, for example, a salary range of £260,000 to £630,000 for a machine learning research engineer when the average salary in London for the same role is around £102,000. Some founders in the U.K., like those in Silicon Valley, are being forced to raise more and bigger rounds to keep up.
“The real test is whether more globally significant AI companies are founded, funded, and scaled from the U.K., while continuing to attract the world’s best talent to build them here,” Zain Ali, founder of the King’s Cross-based AI legal firm Centuro, told me. “If that continues to happen, King’s Cross won’t just be an AI hub. It’ll become one of the U.K.’s most important strategic assets.”
When you purchase through links in our articles, we may earn a small commission. This doesn’t affect our editorial independence.#Thisformernotorious #redlight #districtis #nowone #worlds #top #hubs #TechCrunchUK")

![This former notorious red-light district is now one of the world’s top AI hubs | TechCrunch
What every U.K. AI startup wants to know these days is, how can I get office space in King’s Cross?
The area is so hot that a VC firm allegedly recently won a deal by promising a founder office space in the neighborhood. “We stop at nothing to win deals [for] and to support” founders, “including helping them source office space when needed,” the firm told me when asked about the rumor, declining to confirm or deny any details.
The neighborhood’s popularity began back in 2016 when DeepMind — then newly acquired by Google — moved in. Soon after, a flood of AI startups followed, wanting to be around the Google DeepMind magic. Today, they hope to take advantage of the cluster of AI talent there.
This has transformed King’s Cross into one of the world’s top AI hubs, rivaled only by San Francisco and Beijing. Around London, it’s known by the sobriquet “Knowledge Quarter,” as it’s home to names like OpenAI, Meta, Isomorphic Labs, Cusp AI, Wayne, Recursive, and, a little farther down the road, Synthesia and Anthropic. The European Technology Network (ETN) just moved into a glossy new office nearby, while University College London sits around the corner.
Mixed in with the new developments are trendy food spots like Hoppers and BAO. Hop a train from King’s Cross, and founders can be in Cambridge in 45 minutes to source talent or can be in Paris in two hours to strike a deal.
Who would have guessed that a little more than 20 years ago, this was one of the seediest areas in London?
“In the ’80s, crack and heroin made the area a major narcotics market,” Hussein Kanji, an investor at Hoxton Ventures, said, recalling syringes in tree trunks and gangs patrolling the streets. “In 1982, the local church was occupied by the English Collective of Prostitutes for 12 straight days.” Then, in the early 2000s, a real estate developer had a dream and, well, “now it is the AI hotbed of the United Kingdom,” Kanji said. “What a change.” Around 18 months ago, his portfolio company BioCorteX moved from the neighborhood Holborn to the Jellicoe building in King’s Cross, hoping to be near the action. “Lots going on in London right now,” Nik Sharma, co-founder of BioCorteX, told me. “Lots of hyperscalers moving in.” That includes, reportedly, Jeff Bezos’ AI company Prometheus, which is also said to be in talks to move into the Jellicoe.
There are around 3,600 AI startups in London, which, together, have raised around .1 billion out of the .8 billion raised in the city since late July, according to Dealroom. Since the start of June, AI-related startups have leased more than 1 million square feet of office space in London, according to the real estate firm Knight Frank. With that, prime rents in King’s Cross have risen 18% over the past three years, Chris Dunn, a commercial insight associate at the firm, told me. That percentage represents only the largest leases encompassing at least 10,000 square feet, like the ones OpenAI and Prometheus are signing. The shorter deals go for even more, he said, and now the vacancy rate for conventional office space is just 0.9%. “Demand has outstripped supply,” he continued.
Today, one of the big topics of the area is sovereignty. It was a wake-up call for many when Anthropic shut off access to Mythos and Fable this summer, leaving some in the ecosystem to conclude: “We’d better look after ourselves,” Saul Klein, co-founder of the VC firm Phoenix Court, told me.
Phoenix Court is located in the King’s Cross area and has three portfolio companies in the vicinity, including Olix (which just announced a .3 billion valuation), Early Health and CoMind. Robin Klein, co-founder of the firm, said the shutdown of Fable and Mythos access was a “small but sharp reminder that Europe can’t simply rent its AI capabilities and capacity; it needs to build and hold some of its own.” King’s Cross, he said, is where much of this building is actually happening.
“The bigger question,” he continued, “is whether the U.K. builds the infrastructure, compute, energy, capital, to make this self-reliance durable, rather than just hosting outposts of U.S. labs.”
Image Credits:Phoenix Court
Top founders want to stay
Simon Kohl, founder of Latent Labs, has offices in King’s Cross and San Francisco. The London office, at the moment, is growing faster, and he’s more bullish than ever on the ecosystem, he said. “The mood right now feels less like London trying to catch up and more like London becoming one of the default places to start a serious AI company,” he said. Look around and you are likely to see Wayve testing its autonomous cars. Founded in 2017 by co-founder Alex Kendall, the unicorn is one of London’s biggest success stories.
“Ten years ago, building a frontier AI company from London felt like an unusual choice,” Kendall told me. “Now it feels like an obvious one.” Wayve moved into King’s Cross in 2018 looking for a space that could double as a garage — “a rare combination in Central London,” Kendall said. He has watched the ecosystem mature around him — and it’s now evident that a startup can stay in London, raise serious capital, hire world-class AI talent, and remain globally competitive, he said. Down the street from Anthropic’s new 158,000-square-foot office is the AI agent builder Sierra and the AI video platform Synthesia.
Laura Gonzalez Florez, Synthesia’s chief of staff and head of people, says the company moved into its glossy new office building a year ago to accommodate its growing team. They were drawn to the area for the same reason as everyone else: “It’s very close to the airport … very close to where a lot of investors are,” she said.
Image Credits:Synthesia
Around two-thirds of Synthesia’s engineers are remote, Gonzalez Florez said, letting the company tap into an affordable, international, and diverse talent pool and helping it scale faster. “From London, we can hire and work, without any problem, people from anywhere, from Slovenia to Portugal,” she said.
Unsurprisingly, London’s AI boom is also causing a talent war.U.K. AI job postings have skyrocketed in the past few years, per data from PwC. When Anthropic announced it moved into town earlier this year, it listed, for example, a salary range of £260,000 to £630,000 for a machine learning research engineer when the average salary in London for the same role is around £102,000. Some founders in the U.K., like those in Silicon Valley, are being forced to raise more and bigger rounds to keep up.
“The real test is whether more globally significant AI companies are founded, funded, and scaled from the U.K., while continuing to attract the world’s best talent to build them here,” Zain Ali, founder of the King’s Cross-based AI legal firm Centuro, told me. “If that continues to happen, King’s Cross won’t just be an AI hub. It’ll become one of the U.K.’s most important strategic assets.”
When you purchase through links in our articles, we may earn a small commission. This doesn’t affect our editorial independence.#Thisformernotorious #redlight #districtis #nowone #worlds #top #hubs #TechCrunchUK](https://i0.wp.com/techcrunch.com/wp-content/uploads/2026/08/DM9A2852.jpg?w=680&ssl=1 "This former notorious red-light district is now one of the world’s top AI hubs | TechCrunch
What every U.K. AI startup wants to know these days is, how can I get office space in King’s Cross?
The area is so hot that a VC firm allegedly recently won a deal by promising a founder office space in the neighborhood. “We stop at nothing to win deals [for] and to support” founders, “including helping them source office space when needed,” the firm told me when asked about the rumor, declining to confirm or deny any details.
The neighborhood’s popularity began back in 2016 when DeepMind — then newly acquired by Google — moved in. Soon after, a flood of AI startups followed, wanting to be around the Google DeepMind magic. Today, they hope to take advantage of the cluster of AI talent there.
This has transformed King’s Cross into one of the world’s top AI hubs, rivaled only by San Francisco and Beijing. Around London, it’s known by the sobriquet “Knowledge Quarter,” as it’s home to names like OpenAI, Meta, Isomorphic Labs, Cusp AI, Wayne, Recursive, and, a little farther down the road, Synthesia and Anthropic. The European Technology Network (ETN) just moved into a glossy new office nearby, while University College London sits around the corner.
Mixed in with the new developments are trendy food spots like Hoppers and BAO. Hop a train from King’s Cross, and founders can be in Cambridge in 45 minutes to source talent or can be in Paris in two hours to strike a deal.
Who would have guessed that a little more than 20 years ago, this was one of the seediest areas in London?
“In the ’80s, crack and heroin made the area a major narcotics market,” Hussein Kanji, an investor at Hoxton Ventures, said, recalling syringes in tree trunks and gangs patrolling the streets. “In 1982, the local church was occupied by the English Collective of Prostitutes for 12 straight days.” Then, in the early 2000s, a real estate developer had a dream and, well, “now it is the AI hotbed of the United Kingdom,” Kanji said. “What a change.” Around 18 months ago, his portfolio company BioCorteX moved from the neighborhood Holborn to the Jellicoe building in King’s Cross, hoping to be near the action. “Lots going on in London right now,” Nik Sharma, co-founder of BioCorteX, told me. “Lots of hyperscalers moving in.” That includes, reportedly, Jeff Bezos’ AI company Prometheus, which is also said to be in talks to move into the Jellicoe.
There are around 3,600 AI startups in London, which, together, have raised around .1 billion out of the .8 billion raised in the city since late July, according to Dealroom. Since the start of June, AI-related startups have leased more than 1 million square feet of office space in London, according to the real estate firm Knight Frank. With that, prime rents in King’s Cross have risen 18% over the past three years, Chris Dunn, a commercial insight associate at the firm, told me. That percentage represents only the largest leases encompassing at least 10,000 square feet, like the ones OpenAI and Prometheus are signing. The shorter deals go for even more, he said, and now the vacancy rate for conventional office space is just 0.9%. “Demand has outstripped supply,” he continued.
Today, one of the big topics of the area is sovereignty. It was a wake-up call for many when Anthropic shut off access to Mythos and Fable this summer, leaving some in the ecosystem to conclude: “We’d better look after ourselves,” Saul Klein, co-founder of the VC firm Phoenix Court, told me.
Phoenix Court is located in the King’s Cross area and has three portfolio companies in the vicinity, including Olix (which just announced a .3 billion valuation), Early Health and CoMind. Robin Klein, co-founder of the firm, said the shutdown of Fable and Mythos access was a “small but sharp reminder that Europe can’t simply rent its AI capabilities and capacity; it needs to build and hold some of its own.” King’s Cross, he said, is where much of this building is actually happening.
“The bigger question,” he continued, “is whether the U.K. builds the infrastructure, compute, energy, capital, to make this self-reliance durable, rather than just hosting outposts of U.S. labs.”
Image Credits:Phoenix Court
Top founders want to stay
Simon Kohl, founder of Latent Labs, has offices in King’s Cross and San Francisco. The London office, at the moment, is growing faster, and he’s more bullish than ever on the ecosystem, he said. “The mood right now feels less like London trying to catch up and more like London becoming one of the default places to start a serious AI company,” he said. Look around and you are likely to see Wayve testing its autonomous cars. Founded in 2017 by co-founder Alex Kendall, the unicorn is one of London’s biggest success stories.
“Ten years ago, building a frontier AI company from London felt like an unusual choice,” Kendall told me. “Now it feels like an obvious one.” Wayve moved into King’s Cross in 2018 looking for a space that could double as a garage — “a rare combination in Central London,” Kendall said. He has watched the ecosystem mature around him — and it’s now evident that a startup can stay in London, raise serious capital, hire world-class AI talent, and remain globally competitive, he said. Down the street from Anthropic’s new 158,000-square-foot office is the AI agent builder Sierra and the AI video platform Synthesia.
Laura Gonzalez Florez, Synthesia’s chief of staff and head of people, says the company moved into its glossy new office building a year ago to accommodate its growing team. They were drawn to the area for the same reason as everyone else: “It’s very close to the airport … very close to where a lot of investors are,” she said.
Image Credits:Synthesia
Around two-thirds of Synthesia’s engineers are remote, Gonzalez Florez said, letting the company tap into an affordable, international, and diverse talent pool and helping it scale faster. “From London, we can hire and work, without any problem, people from anywhere, from Slovenia to Portugal,” she said.
Unsurprisingly, London’s AI boom is also causing a talent war.U.K. AI job postings have skyrocketed in the past few years, per data from PwC. When Anthropic announced it moved into town earlier this year, it listed, for example, a salary range of £260,000 to £630,000 for a machine learning research engineer when the average salary in London for the same role is around £102,000. Some founders in the U.K., like those in Silicon Valley, are being forced to raise more and bigger rounds to keep up.
“The real test is whether more globally significant AI companies are founded, funded, and scaled from the U.K., while continuing to attract the world’s best talent to build them here,” Zain Ali, founder of the King’s Cross-based AI legal firm Centuro, told me. “If that continues to happen, King’s Cross won’t just be an AI hub. It’ll become one of the U.K.’s most important strategic assets.”
When you purchase through links in our articles, we may earn a small commission. This doesn’t affect our editorial independence.#Thisformernotorious #redlight #districtis #nowone #worlds #top #hubs #TechCrunchUK")

Post Comment